People usually say to me, those that know something about trading that is, “hey how come you do not place a stop loss on that order”. I'll tell them something like “yes I could, it would be there or there and this is the amount that I would risk for that trade”, some would be content with that answer but not everyone. Far from it I believe, for them i could show how to trade with using a stop but that is not what will talk about here today. I think it is long overdue and here I'll write a recap of my favorite trading method where as stated in the header, there is no stop loss used, at least not to begin with..
So let's start from the beginning about the methodology, what is this really? Yes this will be good, you did think correctly. The idea is to place trades into the market that themselves are in a decently profitable place (at least perceived) while at the same time not giving the market a chance to do something and punish it when it cannot decide what it wants to do or just goes back and forth. The basic hypothesis is that the market in its entirety is a zero sum game meaning that the sum of its parts will remain the same. Albeit the market might grow larger or smaller over time but the factor of this is so small that it just does not make sense to think about it, daily undulation in the market should then not matter. What we must do then is not to try and outsmart or outplay the market even trying to overpower it, though I have heard rumors that some people have very very much money.. this is a faulty approach imo. The market as a definition in my mind is the entire market, all the indices, all the commodities, all currencies and yes you get the picture. The idea is that if one part of it has an inflow of energy, or in this case money, another has an outflow. The sum of these two though remains quite the same or changes ever so slightly but that happens much slower then we think.
As an example gold might become stronger, or in the market worth more, as compared to the Canadian dollar or perhaps the stock price of apple. This might happen one week, one month even several years, in the end the changes should regress. Everything at a balance. This is the reason I named it the tatsumaki symbiosis system, where we live in balance with something else, one thing could be feeding of another and later not but giving both parties a chance to thrive. This balance should be ever so present in the forex trading world then. At least that is my hypothesis.
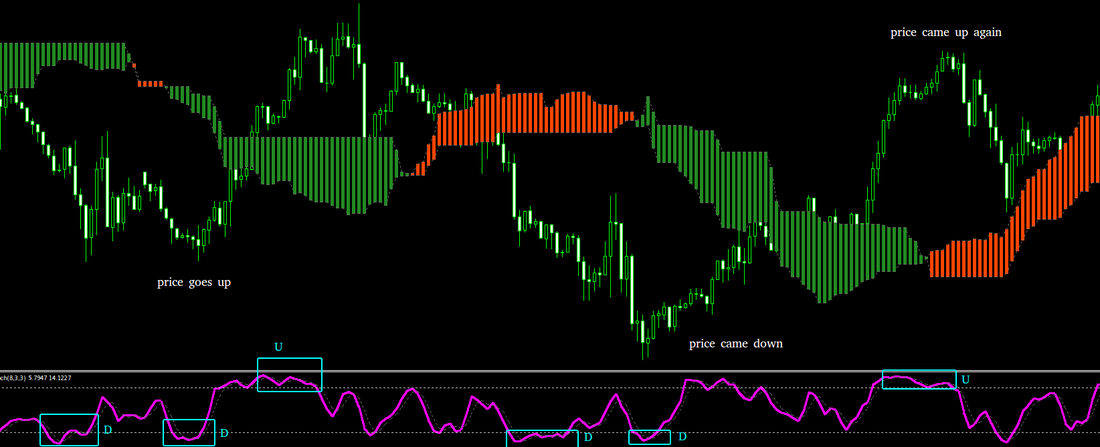
Below you see a picture where price has gone down and then up, moving sideways. While this is certainly not always the case this is an example. What I am showing here is how price in comparisons to the ichimoku “kumo” cloud is on either side, where it is below the kumo while green it I feel it is interesting to buy it and while it is above the kumo while red I feel it is interesting to perhaps short it.
The boxes that I marked in the oscillator denote extremes in price as matched by the up and down movements. Notice how they are called D and U, down and up respectively. Now what I do is to combine this with my own knowledge about how price moves, reading the price formations, looking at the chart and thinking to myself “here it stopped, there it reacted, this formation means power, this formation does not mean anything”. I combine these three aspects and then decide what to do.
Regardless though of what I decide to do using this method there is still the issue of control, this is something that needs to be added to the method. To understand how that is done there is more explaining needed to do though.
Regardless though of what I decide to do using this method there is still the issue of control, this is something that needs to be added to the method. To understand how that is done there is more explaining needed to do though.
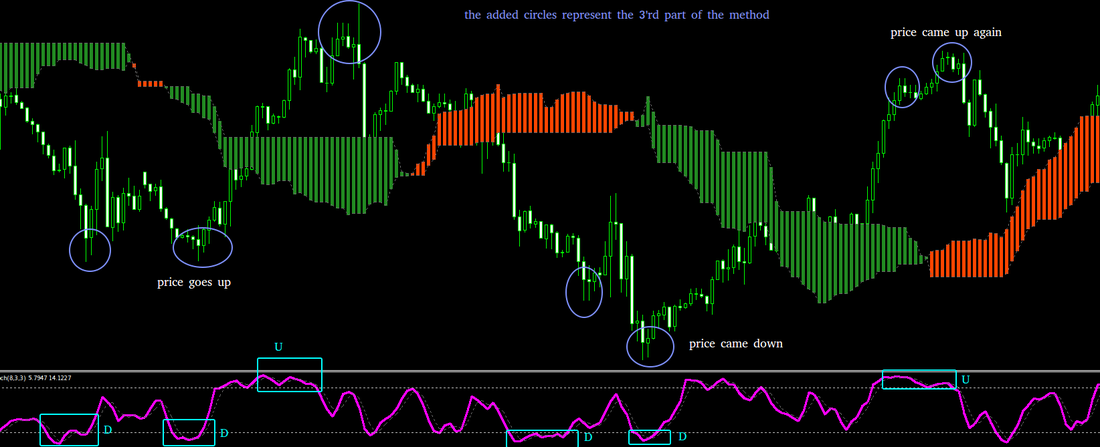
On the picture here i've drawn some circles. Not all of them are potential trades, I only like about half of them really. To be very blunt about it, lets just say that most of the ones here that confirm an already existing area in price are the ones that i'd use. But ok, what about that stop loss then?
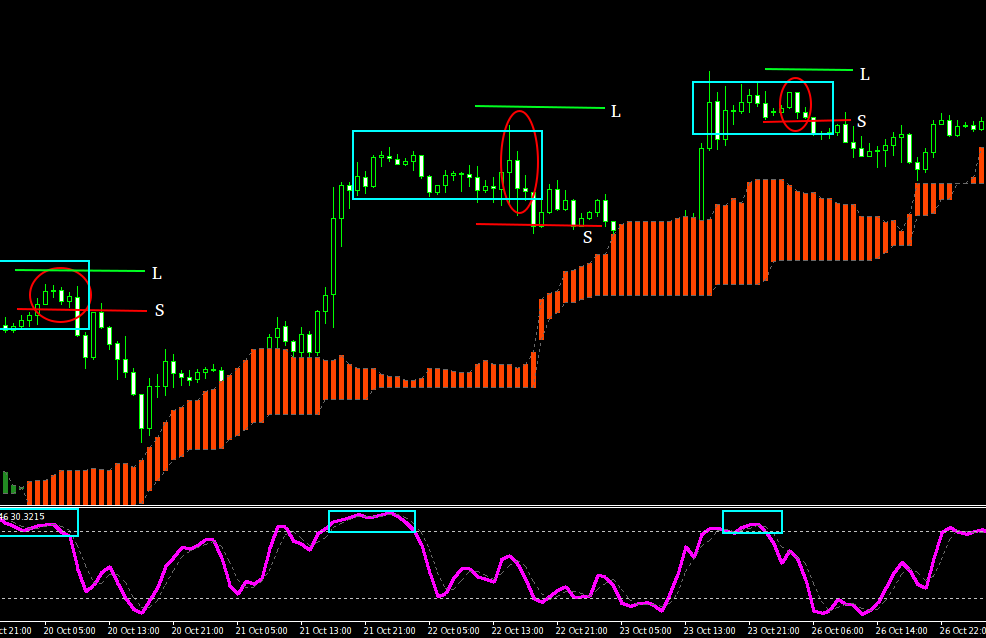
Let me make another picture to explain that part. I've purposefully chosen a section where the signals fail, this to illustrate a point. The stop loss, or the function of it here, is to enter an opposite position if the other one fails to lock in with profit. If profit is locked then the other side, the pending order that here represents the stop loss, is removed. Let it be known that i am not trying to sugarcoat this in any shape or form.
The lines are L long S short and the boxes highlight the extremes on the stochastic oscillator. The red color in our kumo tells us that we only want to go short and that is what I do here, whether by market order or by a pending sell stop.
Now what does end up happening here is that we are left with 2 positions, firstly. Where one eventually is in profit. When does this change though? The rules for that are somewhat complex but to simply it let's just say that when the account isn't under pressure a protecting stop loss, locking in profits, is added and with that another pending order has to be added also. Since if we have one side locked the other cannot be safe because if we did then we would be out of balance. To figure out where to place the new pending order, in this example it is a buy stop, we have to zoom out and check for levels in price. Often it happens that I place these around edges, where price turned. I put the new orders where I think levels will be respected.
That is the entry part of it. But how to make profit really? How did I last week manage to close over 1000 pips? Yes you heard me right a 1000 points. For that part I move the locked positions stop loss more and more into profit as I see it possible. That is rather vague wording I know yes but this part really does need some experience and knowledge of the markets to work. I will try to explain that also though.
That is the entry part of it. But how to make profit really? How did I last week manage to close over 1000 pips? Yes you heard me right a 1000 points. For that part I move the locked positions stop loss more and more into profit as I see it possible. That is rather vague wording I know yes but this part really does need some experience and knowledge of the markets to work. I will try to explain that also though.
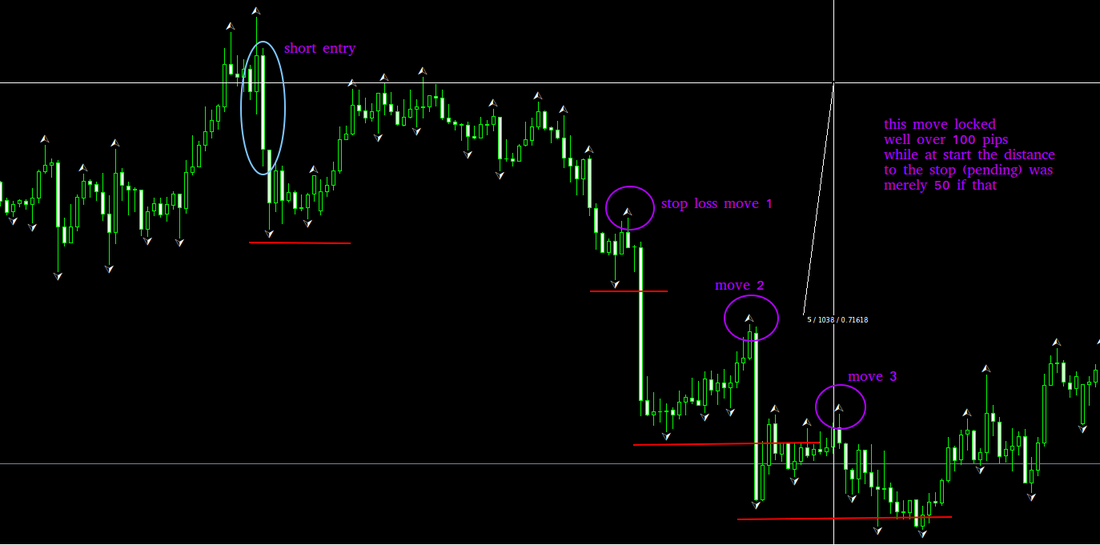
In this picture I show how a short position has it's stop loss moved 3 times. Notice how the red line displays an important level = this is where price held before, isn't that supposed to hold again? It does not and thus the stop loss is moved after price. Locking in more and more pips as we go. I added fractals to the chart so that the beginner more easily can see where the movements stop and are halted though they are not part of the system usually.
As you might understand these principles can be used with many different tools. There is no real need to use a stochastic, for example a rsi or a macd would do also. Or you could try to trade without them as I often do also. The kumo is not needed either but it helps and acts as a filter.
And there you have it really. This description should help you if you want to try these things out, yes I could go into real small details and add some extra stuff but in reality they are not that needed. If you want to read more about this then yes there is a forum thread with more examples and such over at instaforex.


 RSS Feed
