I often tell people when looking at charts "hey look there is the low and that is the high.. " it all seems so clear to me but what i realize afterwards is that well maybe it is not that easy to see for everyone. So i think there is a reason to explain it and here goes.
The Beginning
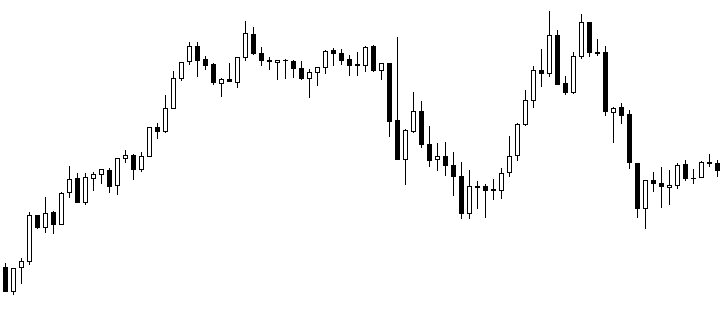
The very fact that price moved like this should tell you as the trader what the important price levels are. So how do we determine them? The answer is that we do not, instead we look at the chart and say "alright so we have this, and we came from where?" that's how it starts at least. I will mark out the chart but firstly now that you've read this far do you think that it is a coincidence that price went back up to the high point the second time or that price fell down to test the area down there again?
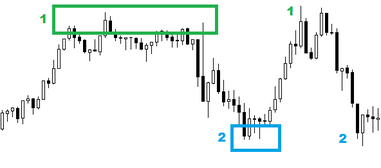
So more points though before we get into it. Obviously price has moved up so how come it stopped at that price is important (1). What we see after that is some sort of chop or trail of price going further up that failed, this does nothing but further prove my point imo. Secondly we see price fall down and how come it stopped there, we do not know really but the second time (2) this happened i think you understand that this is a coincidence. Or so i usually claim.
Even though many claim that price move on news or jada jada.. the fact is that price moved and the reason why is something that really cannot be answered. The thing we can know though is where it went and where it stopped, this is the important part. At least this is it to me since you might think differently.

Now here is the picture again, i did remove some of the extra parts that are not needed for this explanation. Notice how the squares are places where price went again. Also look at the number 1 and how price came back to test 1 and the number 2 and how price came down to test this also.
The unbalance and reasoning
So what we are doing is marking out the areas that are the unbalance in trading. This is useful in the future is price comes back to an area again so that we can be aware if it should react similarly again. Ofc we do not know what actually will happen but it does help with understanding price when we know, or at least think we know, where the unbalance is. And yes here unbalance is the part where we either have to many buyers or to many sellers, that is really what we are marking on the chart.
But what happens if price does not respect a level, this is also a piece of information. Because lets say that price closed under the number (2) on the chart. What we can do with this is to say “alright price wants to be below 2 that should mean that 2 has turned from support into resistance” = this is something that we can use for trading later also.
If you like this stuff make sure to check out this thread in instaforex. That's it for this time, hope you've learned something.

 RSS Feed
